
The U.S. national average FICO Score was 713 in September 2025, while a Federal Reserve-linked measure put the average at 716 in the first quarter of 2025. Those figures don't necessarily conflict: an average depends on the dataset, scoring method, and date. Neither number tells you whether a lender will approve you or what terms it might offer.
For people trying to manage recurring bills, subscriptions, and everyday spending, the practical question isn't whether a score is above average. It's whether your credit profile fits a lender's requirements, and whether your monthly outflows leave enough room to pay reported obligations on time. The national credit scores average is a population statistic, not a personal target.
Table of Contents
- The 2026 National Credit Score Average in One Number
- Why One Average Number Never Tells the Whole Story
- How the National Average Moved From 2013 to 2025
- Comparing National Averages Across the United Kingdom
- The Hidden Divide Behind the National Average
- How FICO Actually Calculates Your Score
- Why Above Average Is the Wrong Goal to Chase
- Practical Moves That Actually Move a Credit Score
The 2026 National Credit Score Average in One Number
The most current figure behind any 2026 search is a 2025 reading: the U.S. national average FICO Score stood at 713 in September 2025, according to Experian's account of the average U.S. FICO Score. No new 2026 national average has been published, so that September 2025 number remains the latest benchmark despite the year in this heading. A Federal Reserve-linked measure came in slightly higher, reporting an average of 716 in the first quarter of 2025 in the St. Louis Federal Reserve's analysis of access to traditional credit.
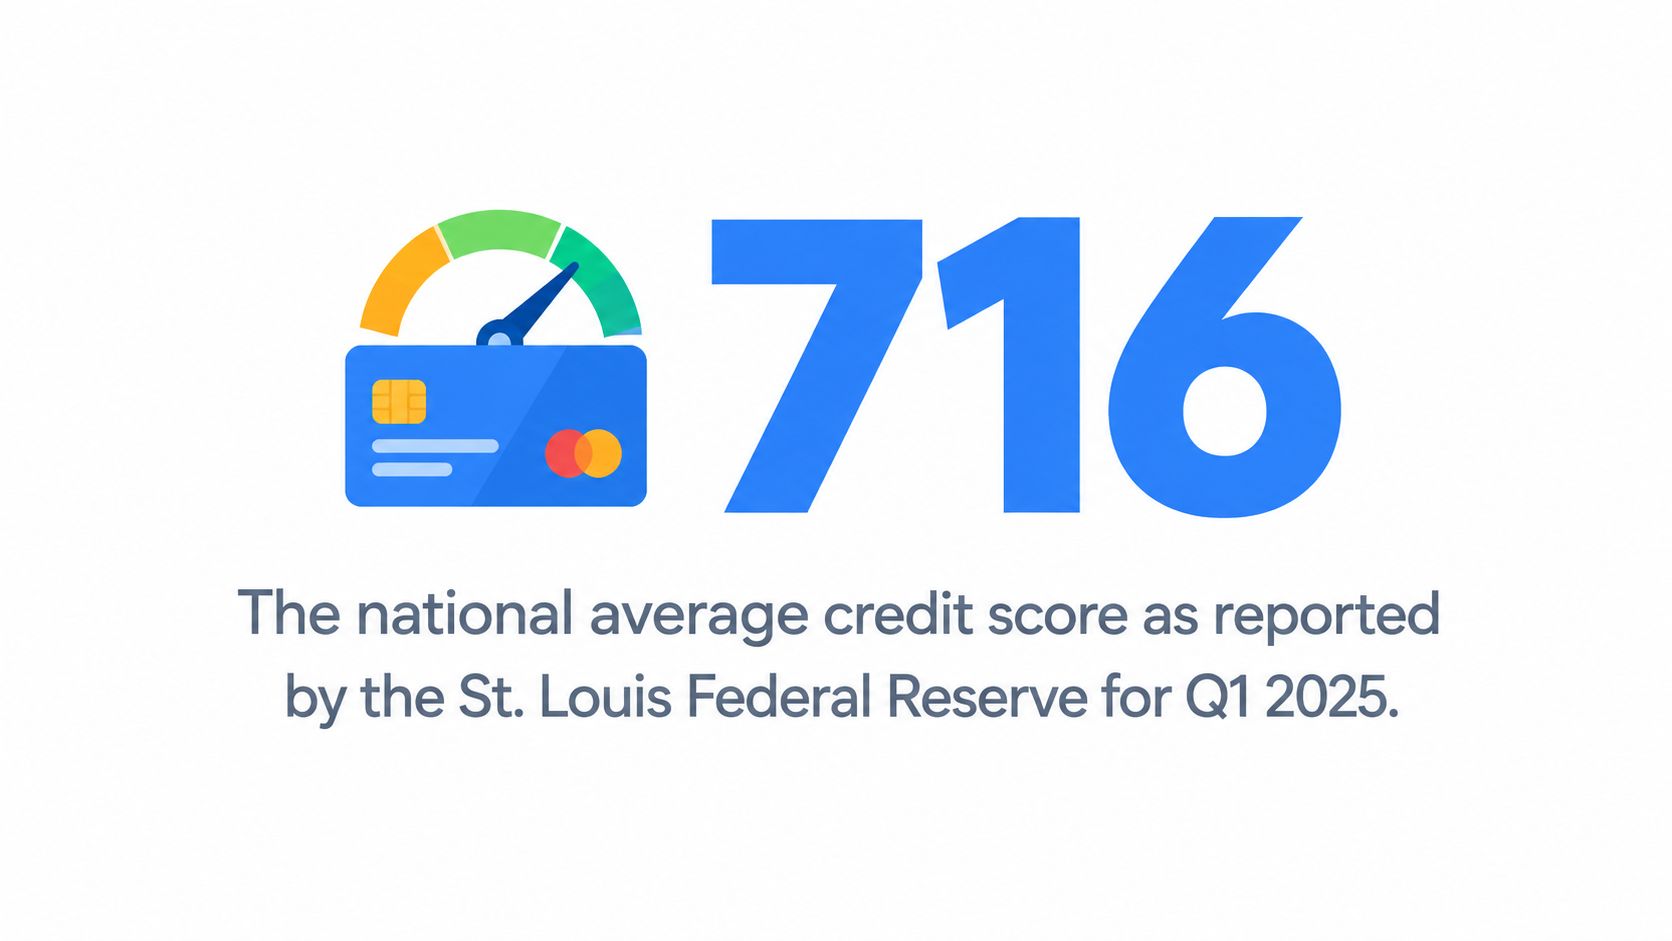
A three-point gap between two national averages traces back to methodology. Each figure aggregates a different population over a different reporting window, even though both sit on FICO's fixed 300–850 scale. An average is an aggregate built to describe a population, and it should be read as a dated marker rather than a live reading on any individual borrower.
A score pulled from an app may also come from a different model version than the one a lender prices against.
Practical rule: When you see an average, check the country, scoring model, source, and date before comparing it with your own number.
Lenders set rates against score tiers, fixed bands where every borrower inside the range gets similar pricing. A score a few points above the national mean can sit in the same tier as one below it, which makes beating the average a weak proxy for what an application will cost.
Why One Average Number Never Tells the Whole Story
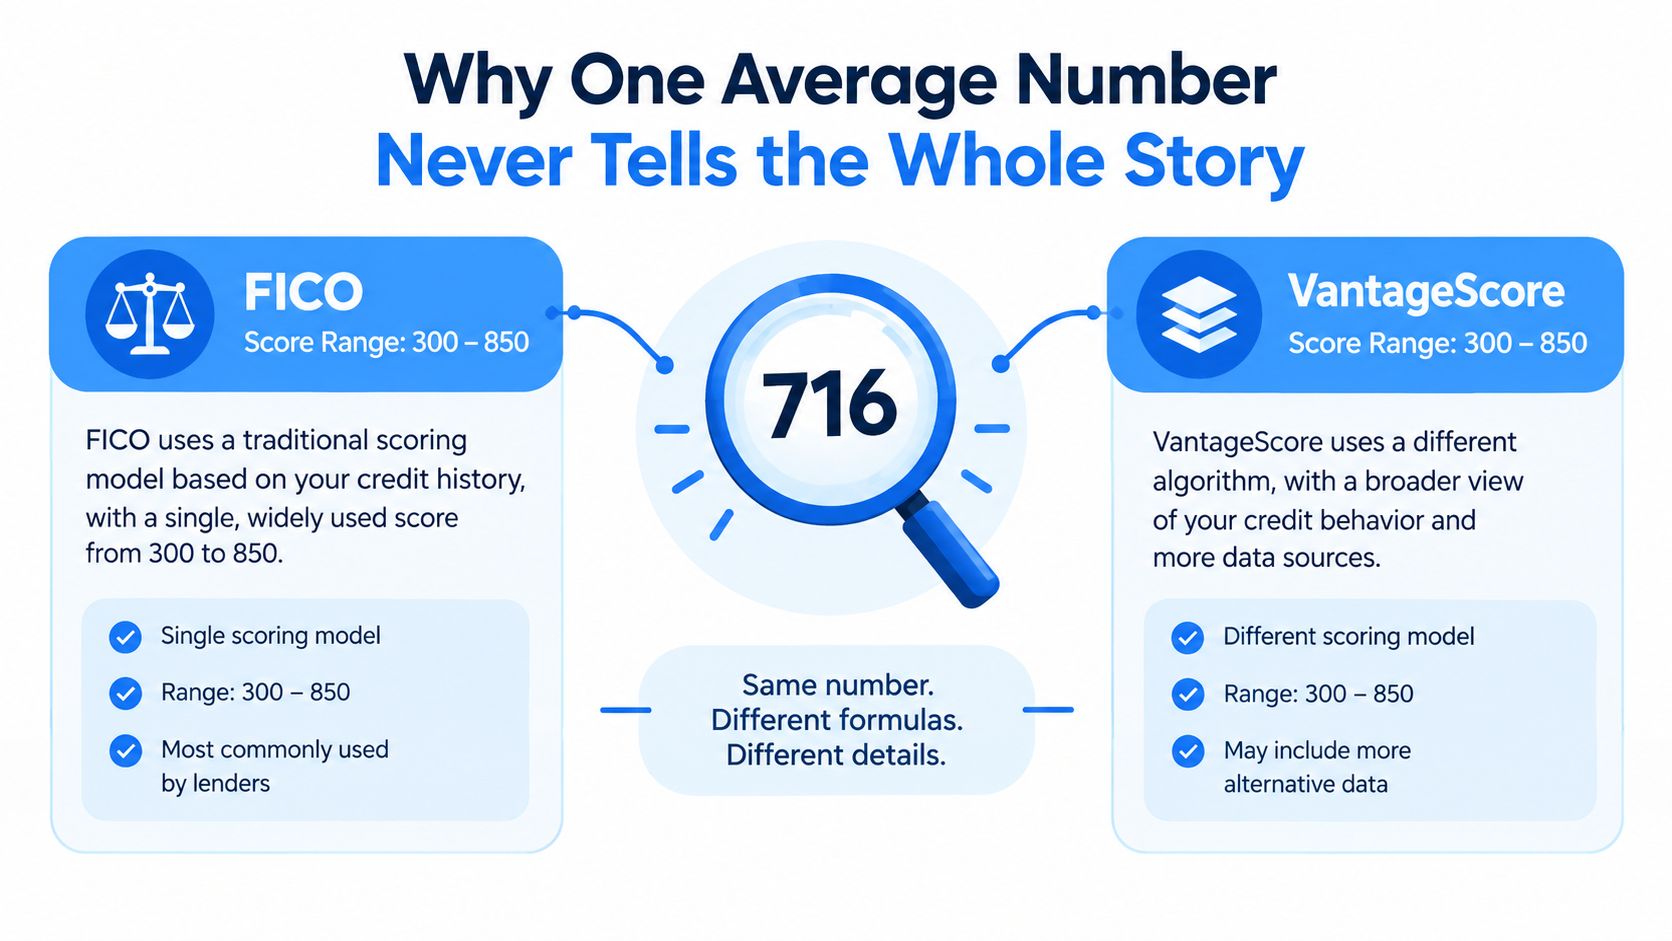
A credit score is produced by a scoring model, not by a universal standard shared across every country and lender. In the U.S., FICO scores use a 300–850 scale, and FICO scores are widely used by lenders. VantageScore is a separate model. Even when scores share a numerical range, that doesn't make them interchangeable: models can assess credit-report information differently, and the score available to you may not match the one used for a particular lending decision.
Credit bureaus collect and maintain credit-report information. Scoring models use information from reports to generate scores. A lender decides which bureau information and score model or version to use. That chain matters because the phrase “average credit score” can refer to different measurements, even when it sounds like one standardized figure.
What to verify before comparing scores
When a website or financial article publishes an average, look for the details behind it:
- Model: Is the figure based on FICO, VantageScore, or another system?
- Bureau and population: Which credit-reporting data and consumers are included?
- Scale and date: What range does the model use, and when was the score measured?
- Statistic: Does “average” mean a mean, a median, or another summary?
Without those details, two figures can look comparable while describing different groups or scoring systems. That's why a score that matches the national headline doesn't necessarily tell you how a lender will assess your application.
The comparison graphic highlights the distinction between FICO and VantageScore, but a graphic can't resolve the most important practical question: which model and version will the lender use? Check any score disclosure that comes with an application or credit offer, and ask the lender which score it considers if the information isn't clear. A national average describes a population; it doesn't tell you which score a lender will pull.
How the National Average Moved From 2013 to 2025
A 2-point decline ended more than a decade of uninterrupted gains. The U.S. FICO average fell from 715 in 2024 to 713 in 2025, the first annual decrease Experian's historical series records since 2013. The longer trend matters for scale: the series shows the average at 710 in 2020, so the reversal arrived after a climb that had already slowed to a near standstill.
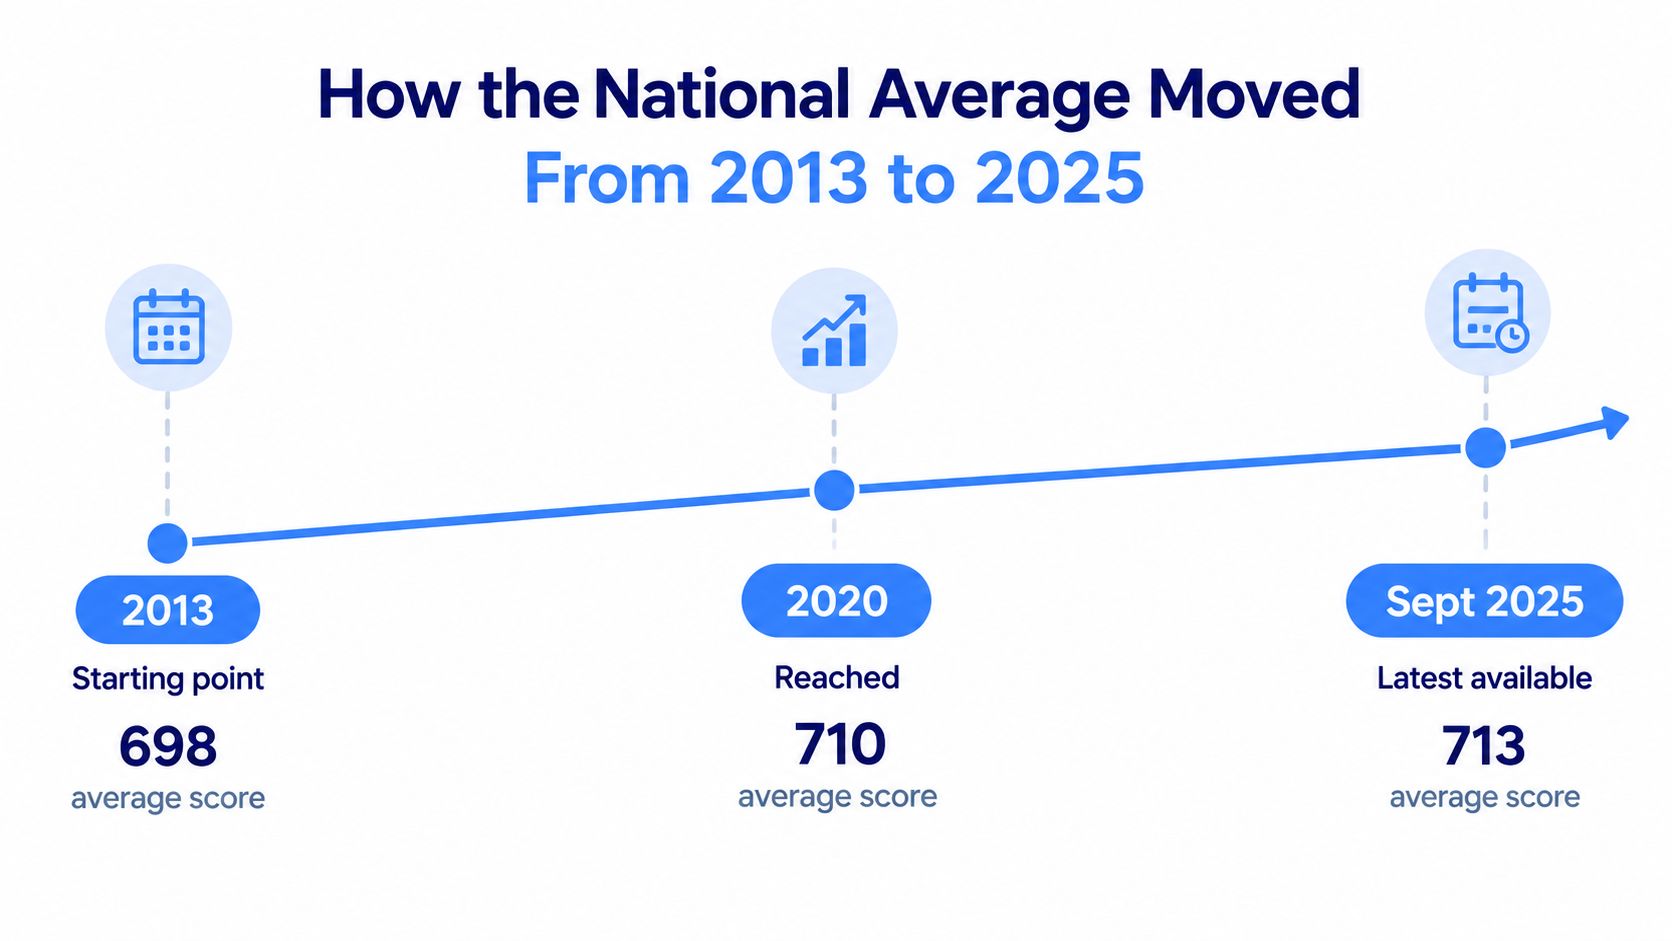
The deterioration was visible months before the September reading. Experian's reporting put the average at 715 in April 2025, down 1 point from January and 2 points from April 2024. That sequence shows why the date attached to a national figure matters. A mid-year result and a year-end result can describe the same trend at different stages, and quoting one without the other distorts the picture.
FICO attributed part of the 2025 decline to the resumption of federal student-loan delinquency reporting and a modest increase in mortgage delinquencies. Both factors operate at the population level. Reporting practices, repayment patterns, and credit utilization can shift a national average even when many individual borrowers see little change in their own files.
What a reversal can and can't tell you
The timeline records a change in a broad average. It is not a forecast for any individual score, and it does not establish that every earlier increase came from one cause. The defensible conclusion is narrower: the average held near historically high levels for years, then registered a measurable decline once repayment stress and reporting changes reached the data.
A single average also conceals who absorbed the drop. A 2-point national decline can reflect stability for most borrowers alongside sharp deterioration for a smaller group, such as borrowers whose student-loan delinquencies returned to their reports after the reporting pause ended. That distributional gap is what headline averages consistently hide.
For your next decision, your own report matters more than the national direction. Check that reported accounts are accurate and current, then focus on payment behavior and balances rather than assuming the trend describes your score.
Comparing National Averages Across the United Kingdom
Three figures describe the UK average credit score in recent reporting: 776, 792, and 797. All three come from Experian's own UK scale, for 2019, 2020, and September 2021 respectively. That attribution matters, because no shared national scoring system sits underneath the headline.
| Reporting period | Average on Experian's UK scale |
|---|---|
| 2019 | 776 |
| 2020 | 792 |
| September 2021 | 797 |
Experian, Equifax, and TransUnion each score UK consumers on different scales, so an Experian reading and an Equifax reading measure credit on incompatible rulers. A 797 under one system and a mid-range score under another can describe the same borrower.
The ClearScore explanation of UK average credit scores adds a second caveat. Within its dataset of more than 14 million users, ClearScore reports medians rather than a mean, with medians running from 470 for people under 20 to 751 for people aged 70–74. A median and a mean answer different questions, so two figures from the same country and the same year can diverge even before the scoring model changes.
A reliable method for cross-country comparisons
Before placing one country's score beside another's, check five things: the model, the scale, the date, the population measured, and the statistic reported (mean or median). If any of those differ, the comparison can mislead more than it informs. The UK figures work best as a demonstration of how scoring systems generate different headlines, rather than as a basis for ranking countries by credit quality.
For a real decision, use the score and criteria that apply to the specific lender you are considering. A country-level average can orient you, but it cannot tell you whether your score is strong under a different system's scale.
The Hidden Divide Behind the National Average
The national average of 716 in 2025 Q1, on the Federal Reserve-linked measure cited earlier, sits well above the typical score in large parts of the country. In the St. Louis Federal Reserve's credit-access analysis, average scores were 655 in low-income census tracts, 685 in moderate-income tracts, 717 in middle-income tracts, and 745 in upper-income tracts.
That is a 90-point spread inside one country's headline number.
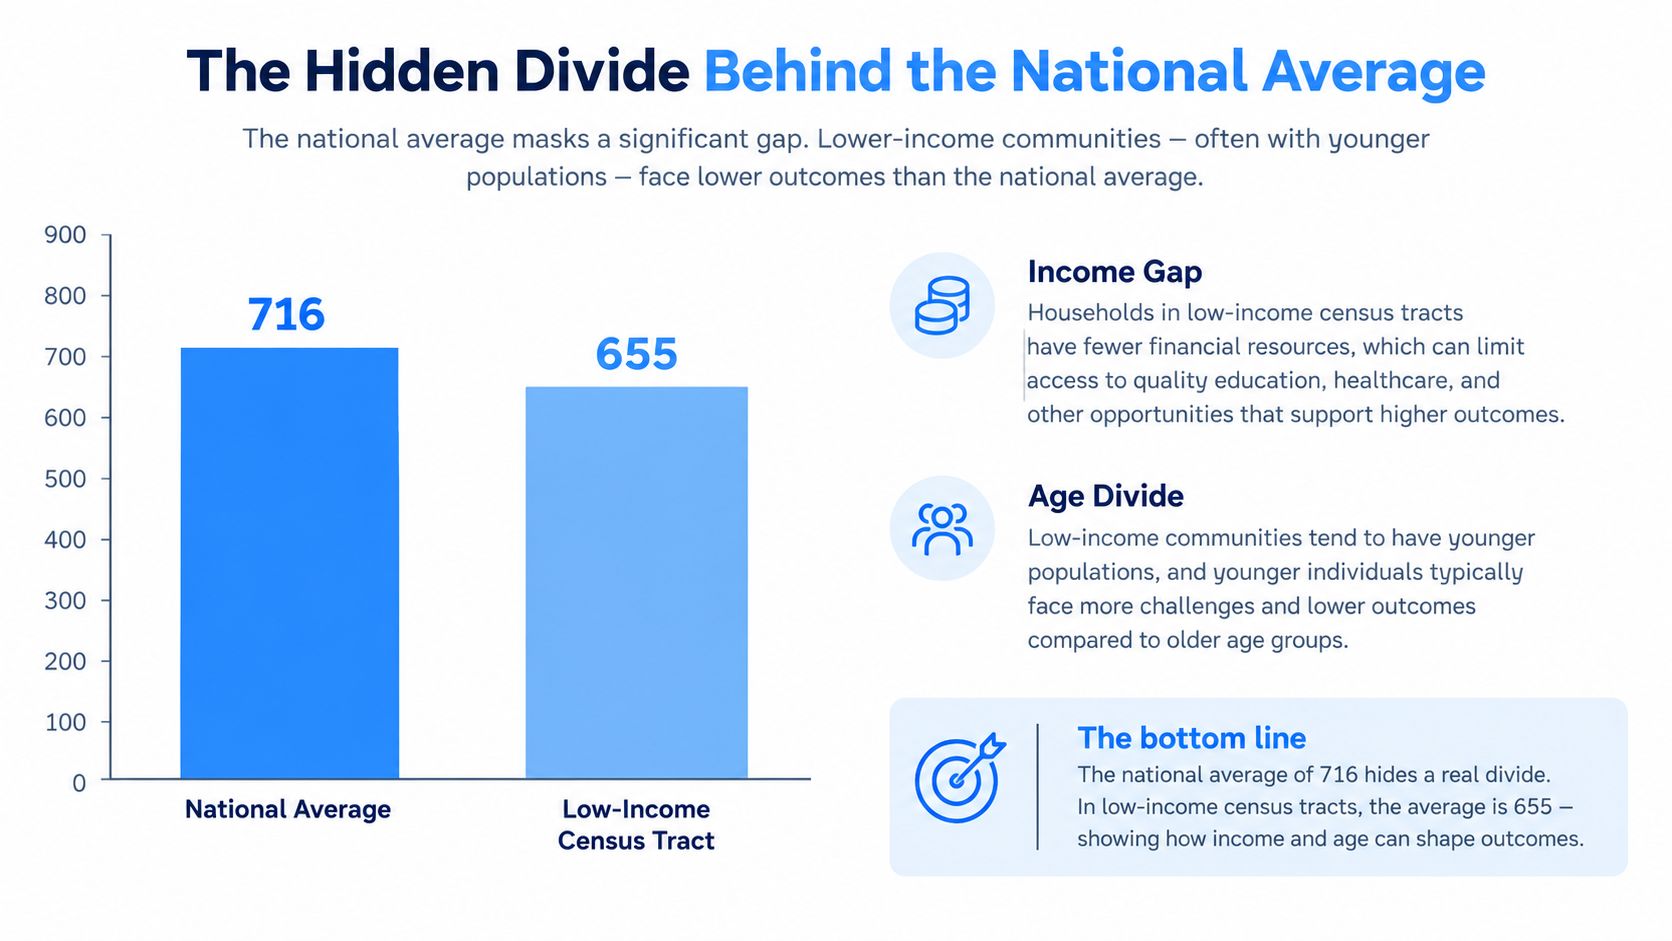
The age pattern is just as steep. According to the same St. Louis Federal Reserve analysis, average scores were 678 for adults aged 18–28 and 689 for those aged 29–44, compared with 747 for ages 61–79 and 760 for people aged 80 and older. Each figure describes a population average, and no lender requires an individual borrower to match one.
Why group averages need context
A shorter credit history leaves younger consumers with fewer years of repayment information on file. Lower financial buffers make an unexpected expense more disruptive, and limited access to mainstream credit shapes which accounts appear in a report at all. The gaps reflect structural conditions as much as individual behavior.
These averages show differences between populations. They cannot reveal the circumstances of any single person inside them.
That distinction matters for personal advice. Telling someone on a volatile income to "just pay on time" overlooks how a surprise bill competes with rent, utilities, or a necessary phone plan. Reducing volatility tends to help more than chasing a scoring trick: track recurring charges, catch renewals before they land, and know which reported obligations need payment attention first.
A healthy-looking national figure can coexist with far lower averages in lower-income areas. For an individual household, the practical response is to protect cash flow and review credit-report information, treating a group average as context rather than a personal verdict.
How FICO Actually Calculates Your Score
FICO scores draw on five categories, but the categories don't carry equal weight. According to FICO's explanation of score factors, payment history accounts for about 35%, amounts owed about 30%, length of credit history 15%, new credit 10%, and credit mix 10%. These weights help separate habits that can affect a credit score from spending changes that mainly affect your bank balance.
Payment history has the largest share. An account matters to this part of the score when it's a credit obligation reported to the relevant credit bureau and its payment performance appears in the report. A routine bank-account debit or an ordinary subscription payment doesn't automatically become a FICO factor.
Amounts owed includes balances relative to available credit. A high balance on a reported revolving account can affect the score, while cutting an unreported recurring expense doesn't directly reduce reported credit balances.
The remaining categories have smaller weights, but they still matter:
- Length of credit history: FICO assigns this category about 15% of the score. A longer history generally helps.
- New credit: This represents about 10%. Applying for or opening multiple accounts in a short period can be viewed as riskier and may negatively affect a score.
- Credit mix: This also represents about 10%. It reflects the types of credit accounts in a report.
Separate spending control from credit scoring
Canceling an unused streaming subscription may free up room in your monthly budget, but it won't directly raise your FICO score just because you canceled it. The distinction is useful: track ordinary recurring expenses to see where money is going, and separately monitor accounts that appear on your credit report.
Recurring costs can still matter indirectly. If unnecessary renewals leave less money available for reported obligations, the household budget becomes tighter. Removing a service you no longer use can help manage outflows, but don't mistake the cash-flow benefit for a direct scoring effect. Pay reported accounts on time; manage subscriptions to protect your budget.
Why Above Average Is the Wrong Goal to Chase
Beating a national average isn't the same as qualifying for a particular financial product or receiving favorable terms. The average describes a population; a lender evaluates an application using its own requirements, including the score model and version it chooses. A score above the headline number doesn't guarantee approval, and a score below it doesn't automatically mean denial.
The data here doesn't establish universal lender tiers or fixed cutoffs for approval and pricing. Those vary by lender, product, model, and application. Treating a general score band as a promise about mortgage, card, or vehicle financing would overstate what an average can tell you.
A comparison with the national average can answer “where do I sit in this population?” It can't answer “what will this lender offer me?”
Instead, ask the institution which score model or version it uses and what criteria apply to the product you're considering. That's more useful than trying to clear an informal threshold found in a generic article. It also helps keep decisions grounded in the actual terms and conditions rather than assumptions built around someone else's score.
For personal planning, set a goal you can act on: keep reported accounts current, avoid unnecessary applications, and check whether your credit report contains accurate information. If you're comparing a product, review the lender's requirements directly. The relevant benchmark is the lender's decision process, not the national average.
Practical Moves That Actually Move a Credit Score
Start with the obligations that appear on your credit report. Because payment history is FICO's largest scoring category, paying reported accounts on time is more directly relevant to your score than cutting an ordinary subscription. Review statements and account reminders so a renewal or other recurring debit doesn't crowd out money reserved for a credit obligation.
Before taking on a new credit product, pause and check whether it's needed. FICO assigns weight to both credit history length and new credit, and FICO's account of these factors says that a longer history generally helps, while multiple applications or openings in a short period can be viewed as riskier. Don't open accounts to plug a budget shortfall, and don't close an older account without first understanding how that could affect your credit profile.
For balances, focus on the reported amount relative to available credit rather than expecting a particular national average to guide you. Check your own report for mistakes, then find out which score model a prospective lender uses before applying. If you're addressing an account in collections, review the steps in this guide to paying off debt collectors and verify the account details before making a payment arrangement.
A recurring-expense review can support those habits by making upcoming outflows visible. List or capture subscriptions, phone service, cloud storage, gym memberships, and regular food-delivery spending. Decide whether to keep, downgrade, skip, or cancel each item, then consider how the freed-up cash could help prevent a missed payment or a sudden balance increase. That's a cash-flow strategy, not a promise that canceling subscriptions will directly improve your score.
To make the review concrete, compare each recurring expense's monthly and annual cost, note when its next renewal is due, and track the savings from services you stop using. Then check your credit report and ask your lender which score it will consider. Those actions focus on the things you can verify, rather than chasing an average that can't predict an individual decision.
FloosYo helps you find recurring charges, record expenses by voice or text, see monthly and yearly projections, and get renewal reminders before charges land. Use its skip-or-stop decisions and savings tracking to manage outflows while you verify the credit information that matters to you. Visit FloosYo to make recurring spending easier to review.